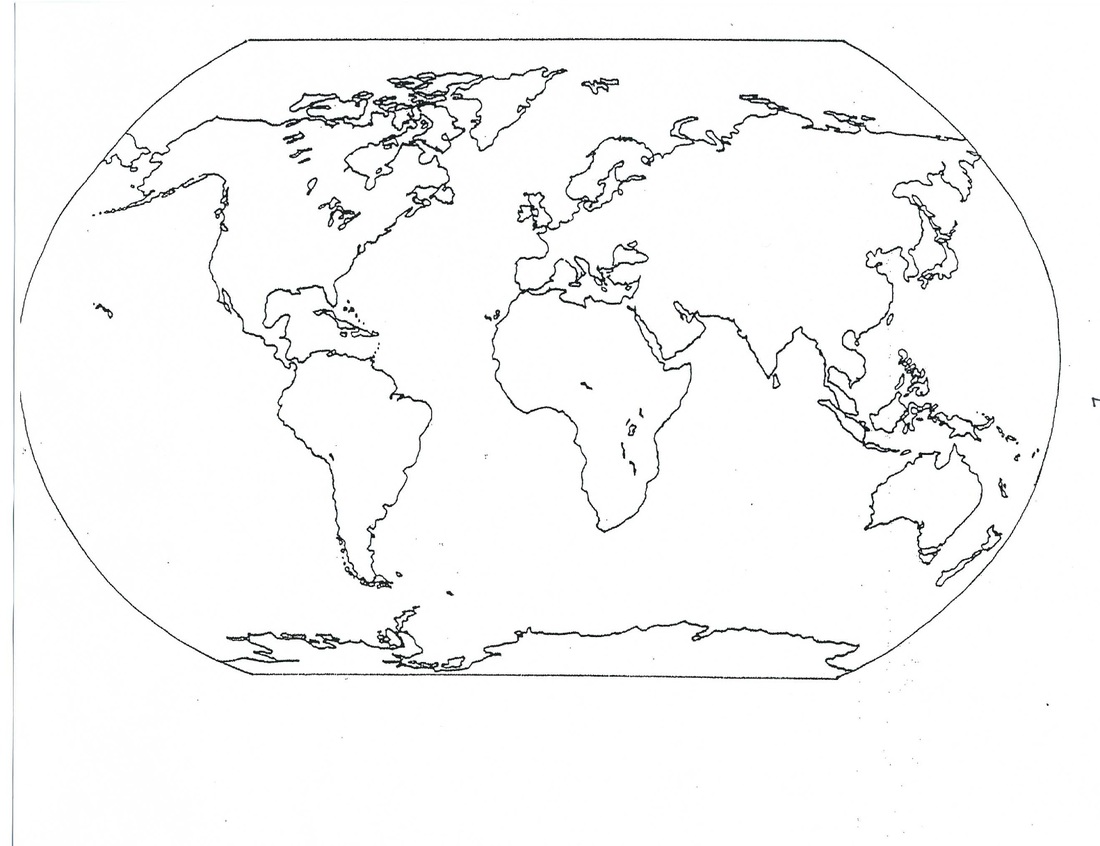
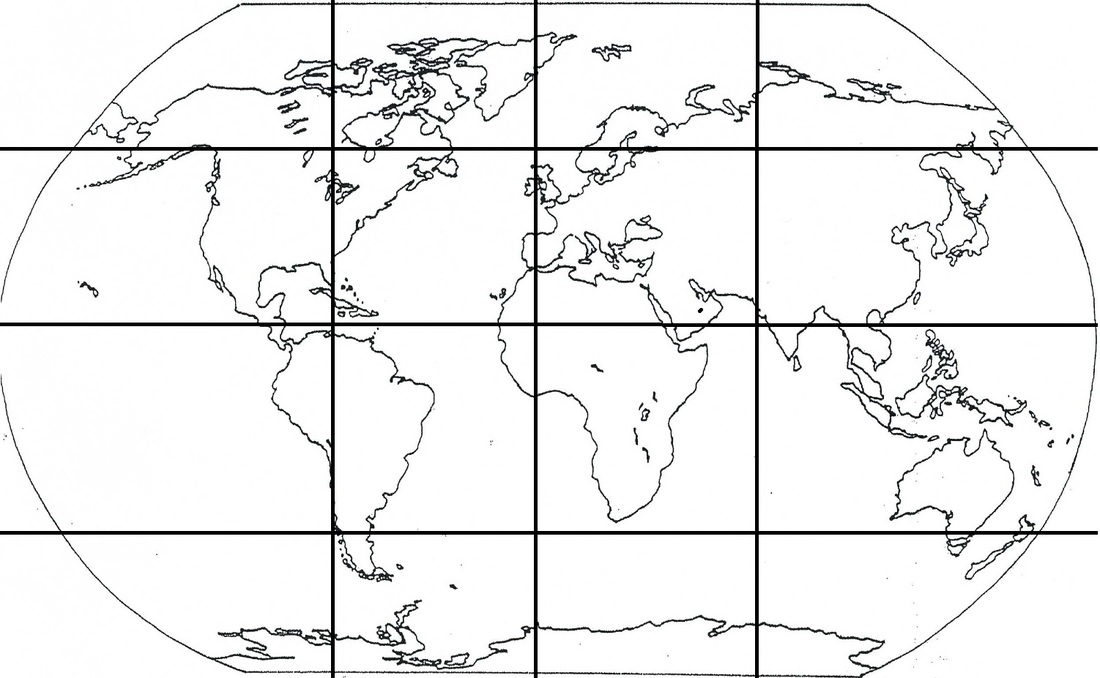
Features you should be able to locate/place on a world map
The 7 continents
The 5 oceans
The following 10 seas- Mediterranean, Arabian, Caribbean, North Sea, Bering, Sea of Japan, South China Sea, Black Sea, Baltic Sea, Scotia Sea
The following 12 rivers- Mississippi, Rio Grande, Nile, Niger, Congo, Danube, Rhine, Amazon, Indus, Ganges, Mekong, Yangtze
The following 11 deserts- Arctic Polar, Antarctic Polar, Great Basin, Patagonian, Kalahari, Sahara, Gobi, Arabian, Syrian, Great Sandy, Great Victoria
The following 12- Andes, Rocky Mountains, Himalayas, Great Dividing Range, Trans-Antarctic, Brazilian East Coast Range, Sumatran Range, Tien Shan, Eastern Ghats, Urals, Alps, Appalachian
|
|
maps by region
|
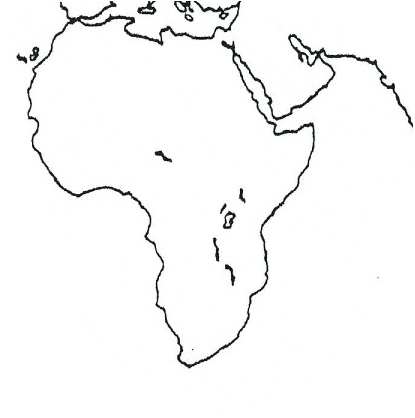
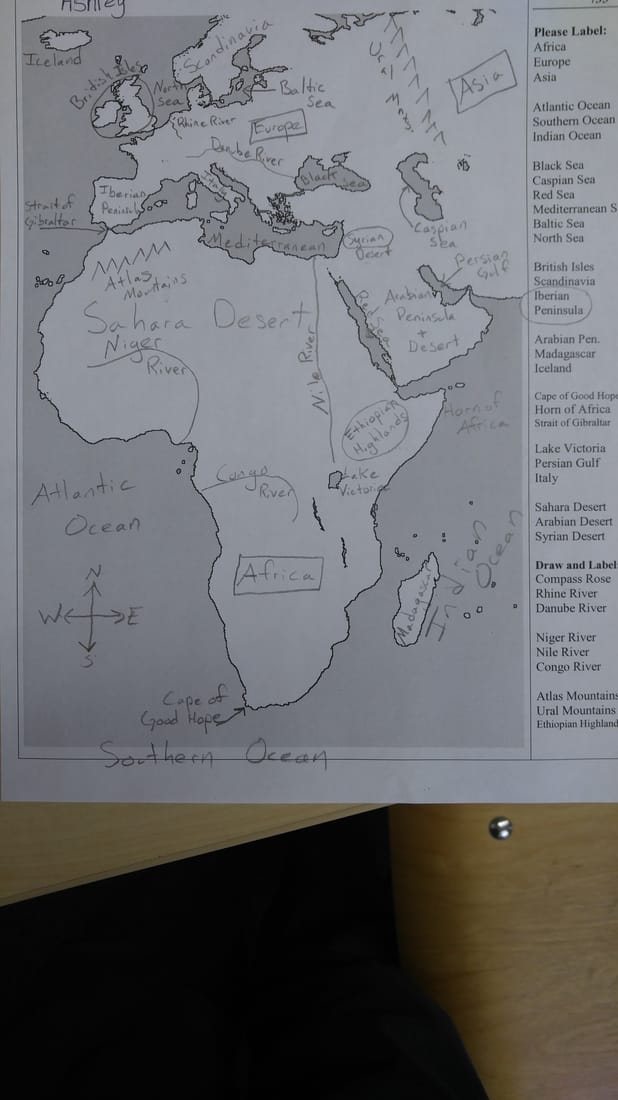
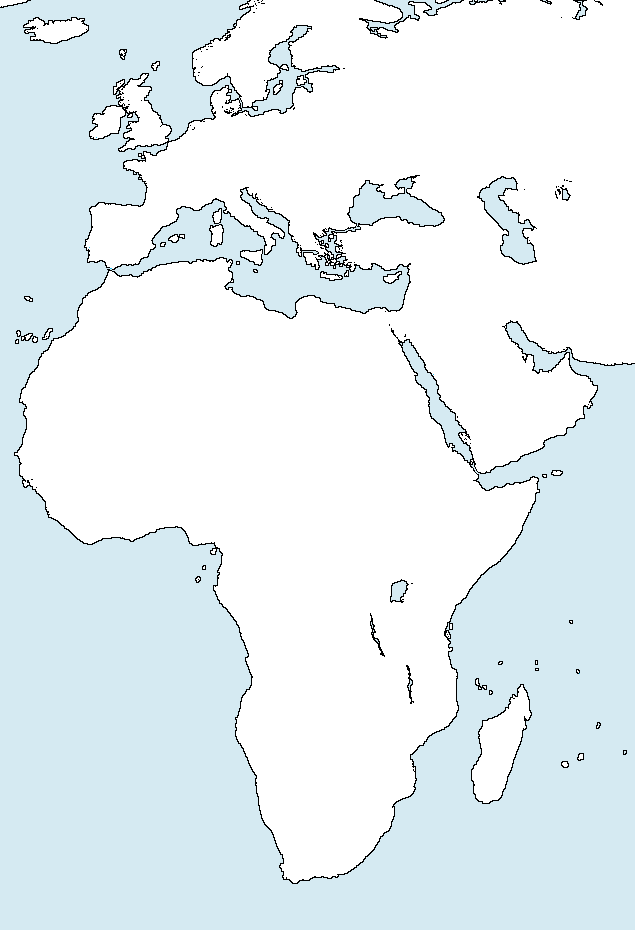
Africa and surroundings
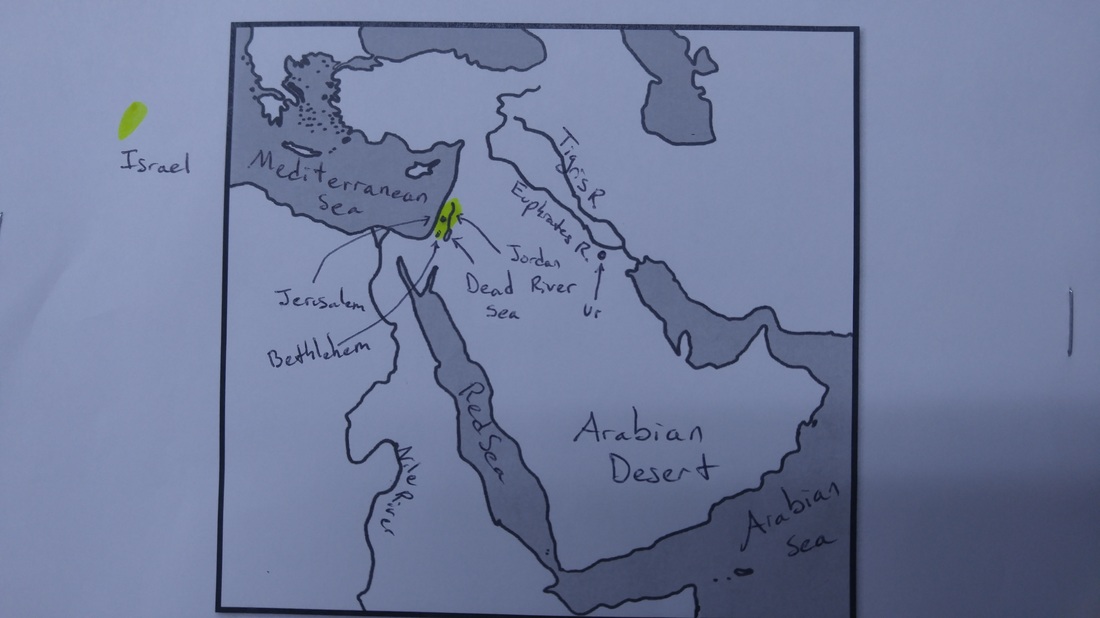
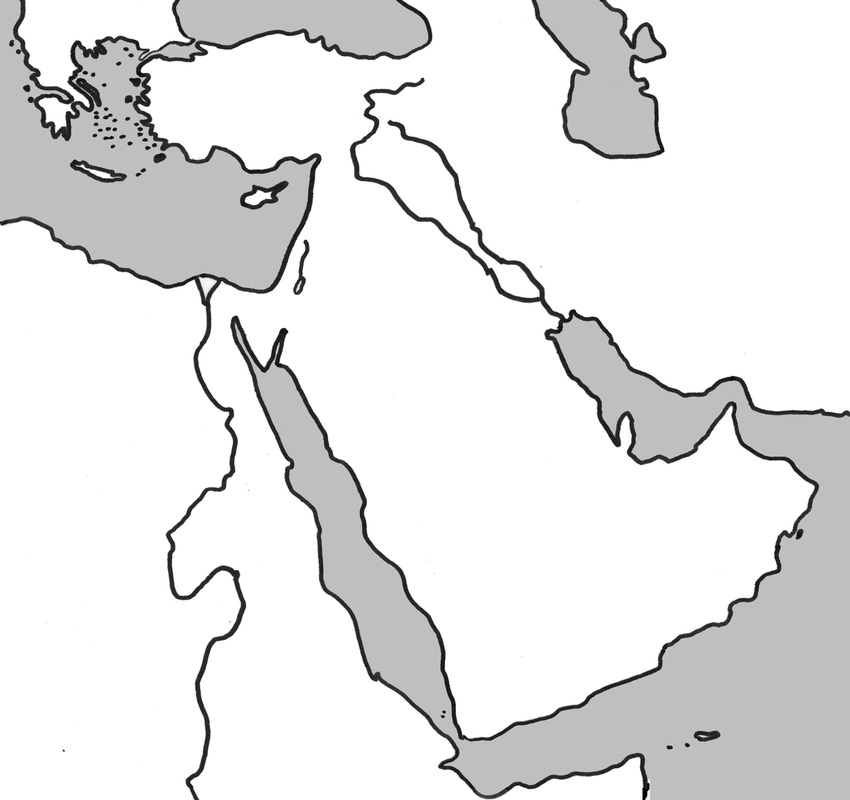
Middle East (Holy Land) for 6th Grade
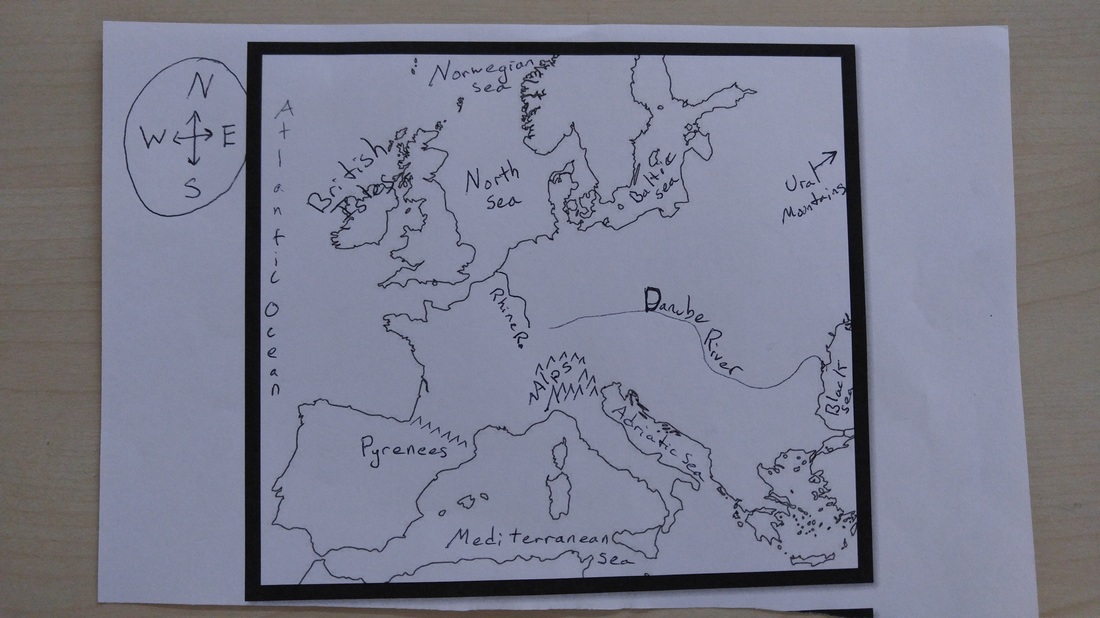
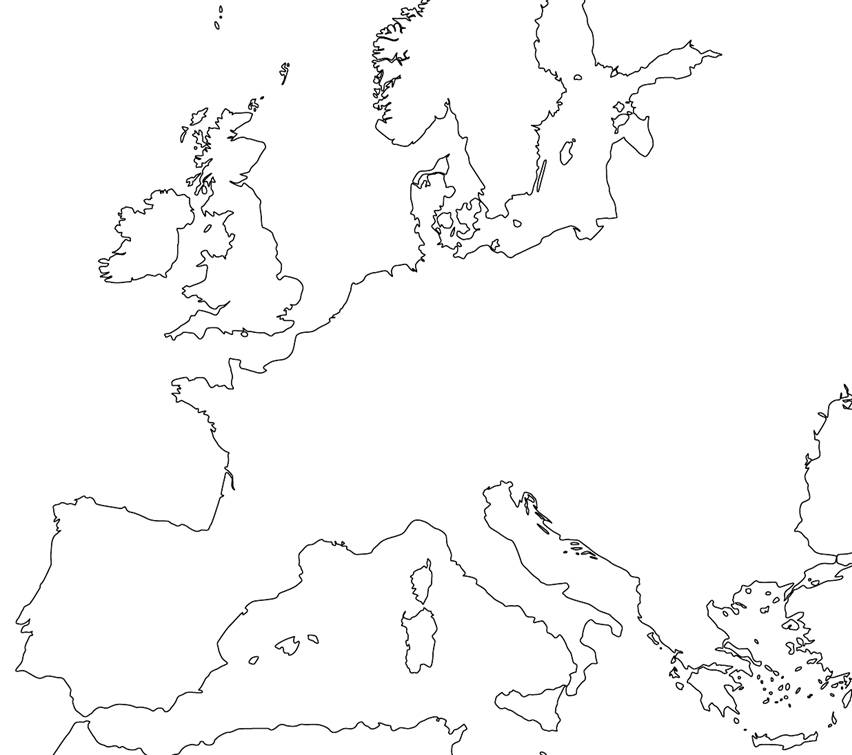
Europe Physical Map
|
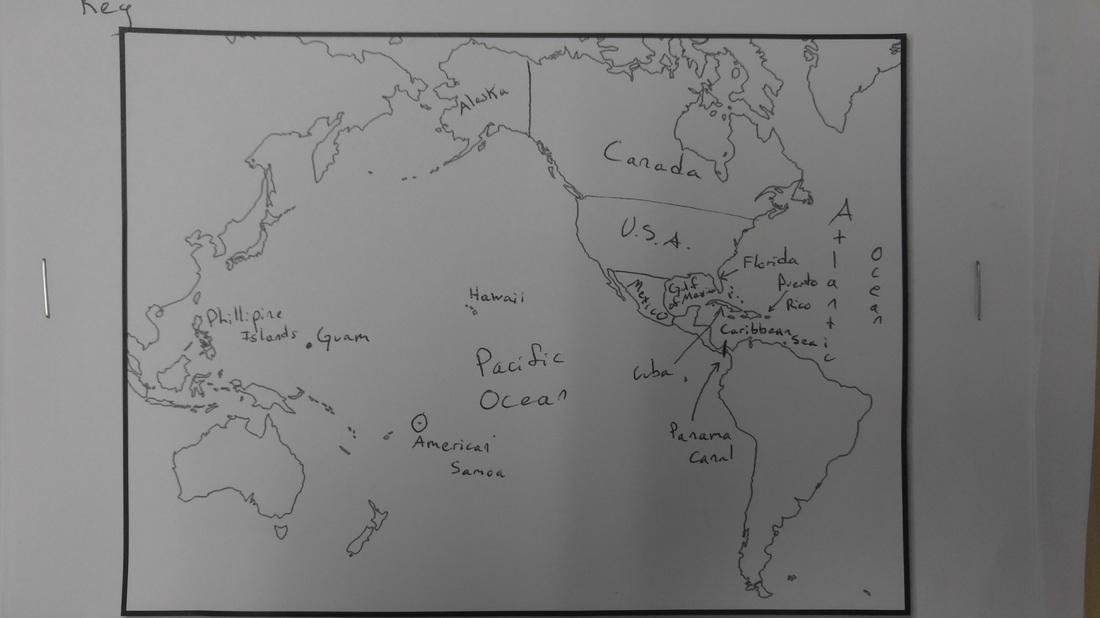
American Imperialism and Spanish-American War for 7th grade
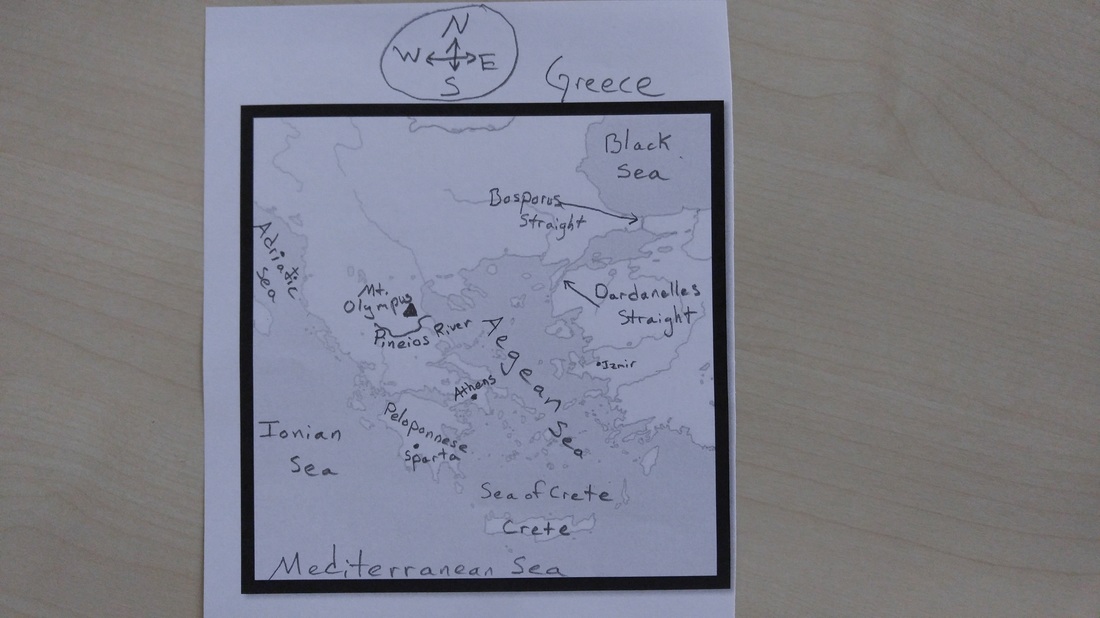
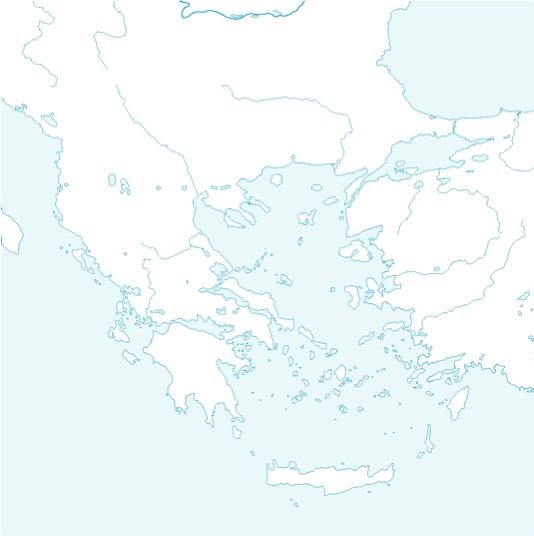
Greece Physical Map
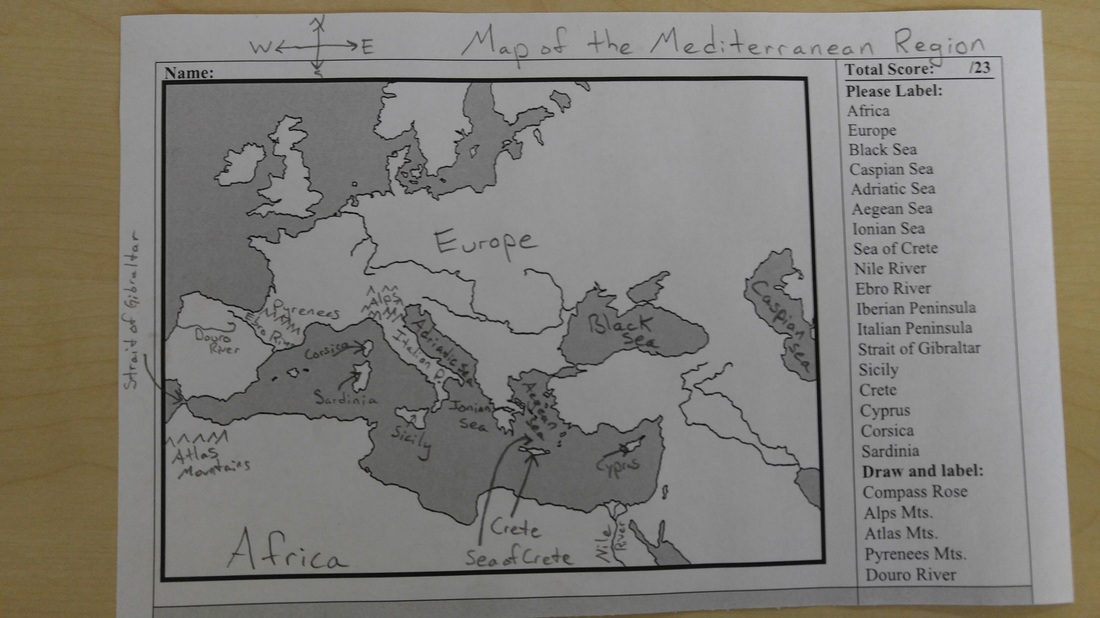
Mediterranean Region
|
|
|
Big Map- africa and europe together
|
|
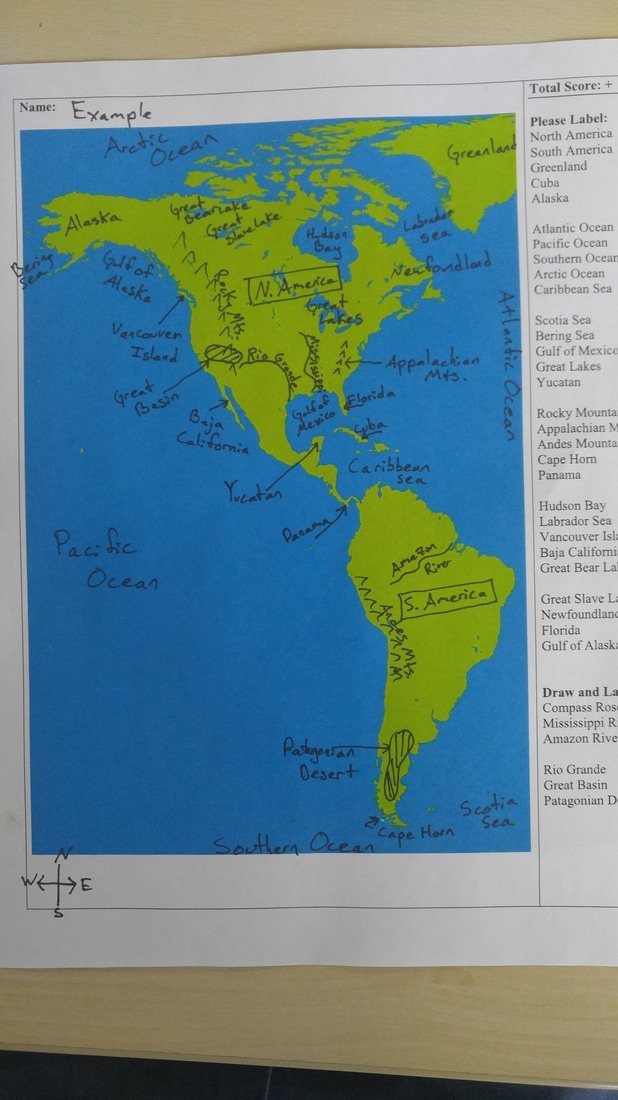
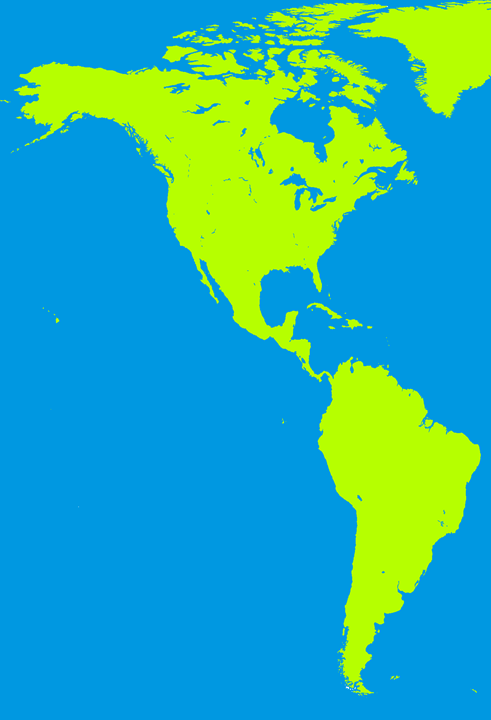
big map- north and south america together
|
|
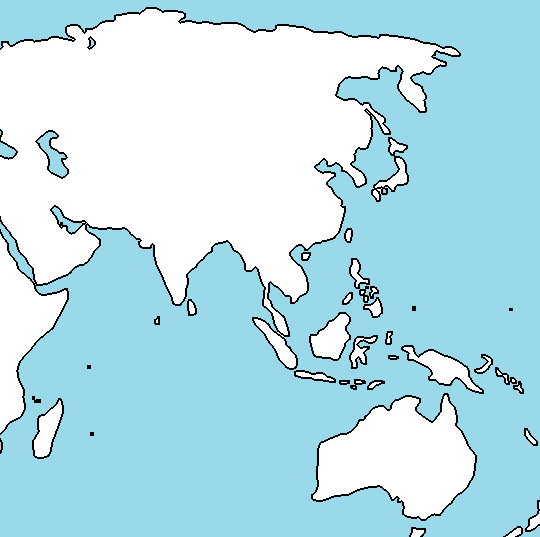
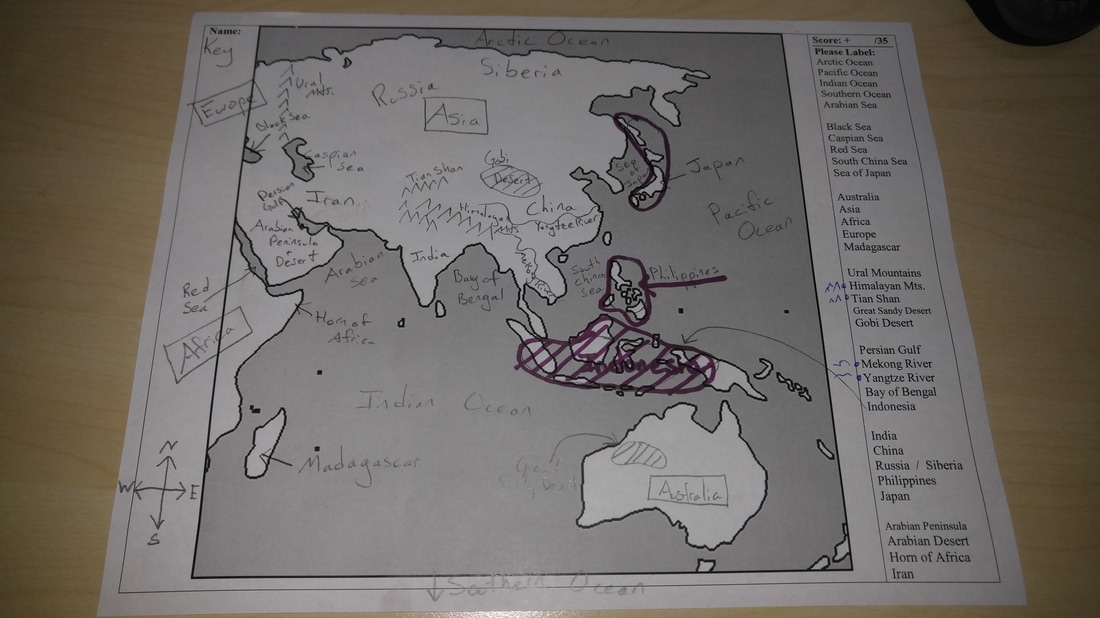
big map- asia and australia
|
|
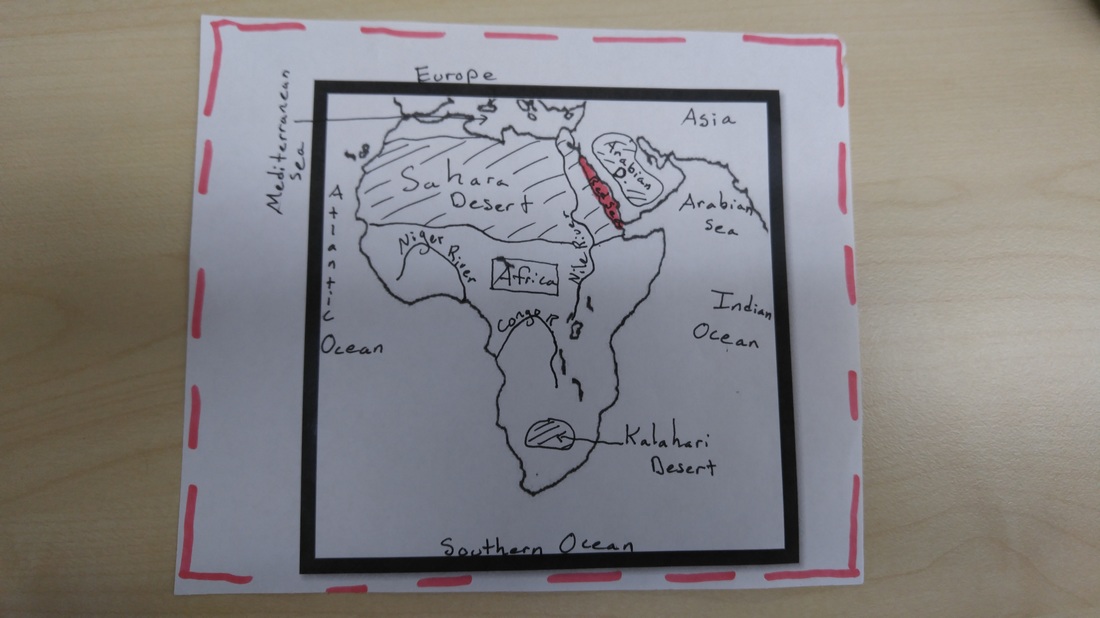
map project directions
Directions
Types of maps include:
Climate maps
give general information about the climate and precipitation (rain and snow) of a region. Cartographers, or mapmakers, use colors to show different climate or precipitation zones.
Economic or resource maps
feature the type of natural resources or economic activity that dominates an area. Cartographers use symbols to show the locations of natural resources or economic activities. For example, oranges on a map of Florida tell you that oranges are grown there.
Physical maps
illustrate the physical features of an area, such as the mountains, rivers and lakes. The water is usually shown in blue. Colors are used to show relief—differences in land elevations. Green is typically used at lower elevations, and orange or brown indicate higher elevations.
Political maps
do not show physical features. Instead, they indicate state and national boundaries and capital and major cities. A capital city is usually marked with a star within a circle.
Road maps
show major—some minor highways—and roads, airports, railroad tracks, cities and other points of interest in an area. People use road maps to plan trips and for driving directions.
Topographic maps
include contour lines to show the shape and elevation of an area. Lines that are close together indicate steep terrain, and lines that are far apart indicate flat terrain.
68.G.1
Spatial Thinking. I use a variety of maps and documents to identify physical and cultural features and to analyze the historical migration of people, expansion and disintegration of empires, and the growth of economic systems.
- Choose a type of map to create (see list below).
- Choose a continent/region to focus this project on. For example, the map could be of just South America, or it could be of Oceania, or any other large-scale region.
- Conduct a bit of research to guide your work.
- Use a variety of materials, scraps, ingenuity to make a (somewhat 3d, textured) model. If you chose to create a resource map, you could represent mines by adding rocks to that location on your map.
- Neatly write down a key that explains to viewers what is on your map. Include a title and compass rose for your map.
- Present it informally to the class. We will display them and walk around and appreciate the class’ work.
Types of maps include:
Climate maps
give general information about the climate and precipitation (rain and snow) of a region. Cartographers, or mapmakers, use colors to show different climate or precipitation zones.
Economic or resource maps
feature the type of natural resources or economic activity that dominates an area. Cartographers use symbols to show the locations of natural resources or economic activities. For example, oranges on a map of Florida tell you that oranges are grown there.
Physical maps
illustrate the physical features of an area, such as the mountains, rivers and lakes. The water is usually shown in blue. Colors are used to show relief—differences in land elevations. Green is typically used at lower elevations, and orange or brown indicate higher elevations.
Political maps
do not show physical features. Instead, they indicate state and national boundaries and capital and major cities. A capital city is usually marked with a star within a circle.
Road maps
show major—some minor highways—and roads, airports, railroad tracks, cities and other points of interest in an area. People use road maps to plan trips and for driving directions.
Topographic maps
include contour lines to show the shape and elevation of an area. Lines that are close together indicate steep terrain, and lines that are far apart indicate flat terrain.
68.G.1
Spatial Thinking. I use a variety of maps and documents to identify physical and cultural features and to analyze the historical migration of people, expansion and disintegration of empires, and the growth of economic systems.
